Coordax and Xarray
Key concepts:
to_xarray()andfrom_xarray()allow conversion betweenFieldandxarray.DataArrayobjectsCustom coordinates need to implement serialization methods
Xarray is a tool of choice for many serialization and visualization standards. To make tapping into this ecosystem easy, Coordax provides easy and lossless (round-trip) conversion between xarray.DataArray and Field.
Let’s start with a simple example:
import coordax as cx
import jax
import jax.numpy as jnp
import numpy as np

xc = cx.LabeledAxis('x', np.linspace(0, 1, 5))
yc = cx.LabeledAxis('y', np.linspace(0, 1, 10))

fn = lambda x, y: jnp.exp(-(x-0.5)**2) * jnp.sin(15 * x * y)
field = cx.cmap(fn)(xc.fields['x'], yc.fields['y'])
dataarray = field.to_xarray()

print(f'{field=}')
print()
print(f'{dataarray=}')
field=<Field dims=('x', 'y') shape=(5, 10) axes={'x': LabeledAxis, 'y': LabeledAxis} >

dataarray=<xarray.DataArray (x: 5, y: 10)> Size: 200B
array([[ 0.        ,  0.        ,  0.        ,  0.        ,  0.        ,
         0.        ,  0.        ,  0.        ,  0.        ,  0.        ],
       [ 0.        ,  0.38019413,  0.6953318 ,  0.89148855,  0.93509924,
         0.81870145,  0.5622125 ,  0.20952119, -0.17902195, -0.5369322 ],
       [ 0.        ,  0.74017686,  0.99540794,  0.5984721 , -0.19056788,
        -0.8547528 , -0.9589243 , -0.4348321 ,  0.37415108,  0.93799996],
       [ 0.        ,  0.89148855,  0.5622125 , -0.5369322 , -0.90082604,
        -0.03116854,  0.88116944,  0.5868739 , -0.51106054, -0.9091715 ],
       [ 0.        ,  0.7752245 , -0.14841442, -0.746811  ,  0.29138917,
         0.69102514, -0.4236841 , -0.6099121 ,  0.5404498 ,  0.5064447 ]],
      dtype=float32)
Coordinates:
  * x        (x) float64 40B 0.0 0.25 0.5 0.75 1.0
  * y        (y) float64 80B 0.0 0.1111 0.2222 0.3333 ... 0.7778 0.8889 1.0
We can restore a Field object from a DataArray using from_xarray().
restored = cx.from_xarray(dataarray)

assert field.coordinate == restored.coordinate
np.testing.assert_allclose(restored.data, field.data)
Serialization of custom coordinates
How do we get back coordinates other than LabeledAxis?
To support restoration of different coordinate objects, Coordinate classes can implement custom from_xarray method. Then, by providing candidate classes to Field.from_xarray (via coord_types arg), an appropriate coordinate will be instantiated.
As an example, here’s a simple example of implementing a Coordinate that only matches uniformly-spaced xarray coordinates:
from typing import Self
import xarray

@jax.tree_util.register_static
class UniformAxis(cx.LabeledAxis):
  """UniformAxis with from_xarray implemented."""

  @classmethod
  def from_xarray(
      cls, dims: tuple[str, ...], coords: xarray.Coordinates
  ) -> Self | cx.NoCoordinateMatch:
    dim = dims[0]
    name = dim  # attempt to use given name.
    if coords[name].ndim != 1:
      return cx.NoCoordinateMatch('UniformAxis coordinate is not a 1D array')

    got = coords[name].data
    steps = np.diff(got)
    if not np.allclose(np.max(steps), np.min(steps), rtol=1e-6):
      return cx.NoCoordinateMatch(
          f'UniformAxis should have uniform spacing, got {steps=}'
      )
    return cls(name=name, ticks=got)
def make_uniform_axis(name, size, length):
delta = length / size
centers = np.linspace(delta / 2, length - delta / 2, size)
return UniformAxis(name, centers)
xc = make_uniform_axis('x', 20, 1)
yc = make_uniform_axis('y', 30, 1)
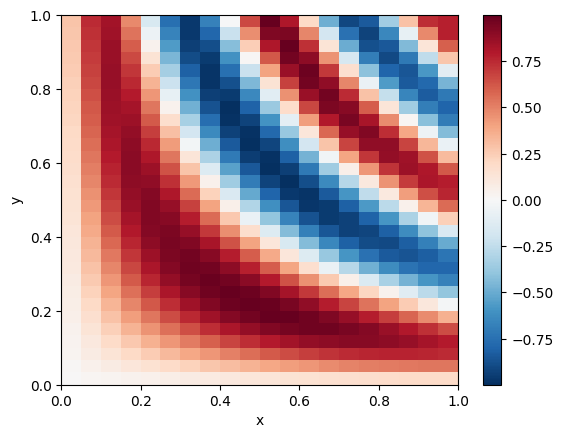
fn = lambda x, y: (jnp.exp(-(x-0.5)**2) * jnp.sin(15 * x * y))
f = cx.cmap(fn)(xc.fields['x'], yc.fields['y'])
da = f.to_xarray()
da.plot(x='x', y='y')
Matplotlib is building the font cache; this may take a moment.
<matplotlib.collections.QuadMesh at 0x78104e605d00>
To create a Field with our custom coordinate from an xarray.DataArray, you need to explicitly
provide it in the coord_types argument to from_xarray().
cx.from_xarray(da, coord_types=[cx.SizedAxis, UniformAxis])
<Field (
  dims=('x', 'y'),
  shape=(20, 30),
  axes={
    'x': UniformAxis(name='x', ticks=<np float64(20,)>),
    'y': UniformAxis(name='y', ticks=<np float64(30,)>),
  },
)